TL;DR
We promote your brand on Thank You pages of other brands. This is achieved via a custom widget. When the widget is loaded on a Thank You page, it first renders a loader while it fetches the promotions. We reduced the time to render the loader by more than 90%, reducing the time to render promotions by 40% on average.
The need for speed
Website speed directly impacts conversions. You need not take our word for it - the effects of slow-loading web pages on site abandonment and conversion has been proven repeatedly. Humans can detect delays as brief as 0.1 seconds, so any response that takes longer doesn't feel instant. More importantly, humans can maintain an uninterrupted flow of thought of only about 1 second. Anything longer changes the experience into one of waiting for the system to catch up.
Being part of the Cay network gets you discovered by customers with high purchase propensity and D2C acceptance. We do this by promoting your store on the Thank You pages of brands that complement your own. These promotions load in our custom widget on the Thank You page. If we break this process to its core, one realizes it is governed by the same rules as any commerce website. The promotions must load quickly, or we risk losing customers' attention. Moreover, the benchmark is higher for us as customers are not expecting to discover new brands on the Thank You page. If we do not render content within an acceptable duration after the primary content, customers are very likely to close the page and leave!
How does our widget load
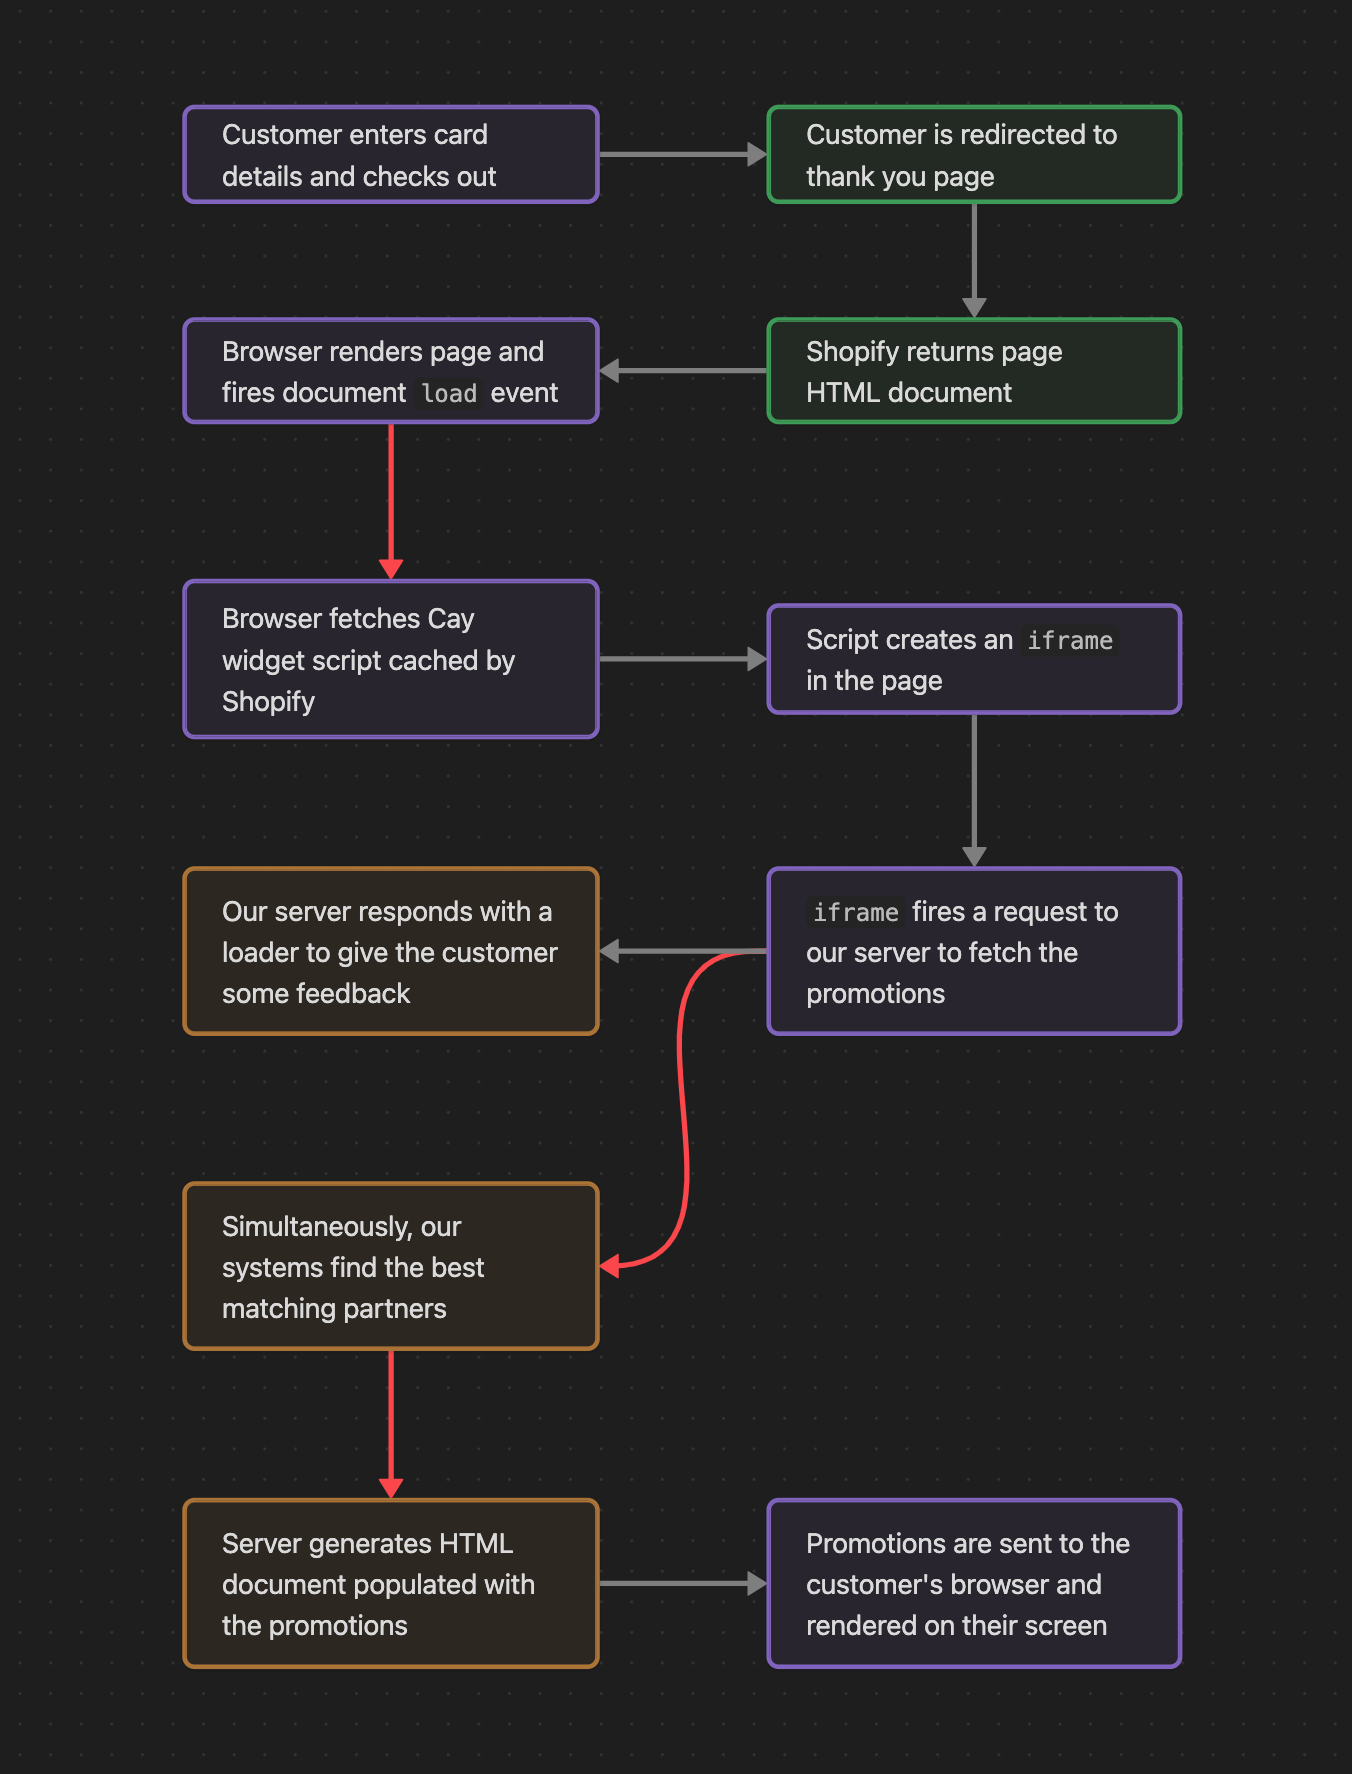
When a Thank You page is requested, a chain of our events is set in action. The request first goes to Shopify's servers, where the page's HTML document is generated and returned to the browser. This HTML contains a bunch of script and link tags that define other resources that the browser then downloads and executes. This whole process is called a request waterfall. You can see a representation of this using the Request Map Generator.
Another essential point to note here is that we can instruct the browser to load scripts synchronously - blocking the page render and hence likely substantially affecting page performance, or asynchronously - after the page has been rendered and, therefore, less likely to affect page performance.
With this background set, let's see how Cay's widget loads. As you would have probably guessed, our widget is also a script. We make use of Shopify's script tag API to load it on the Thank You page. Now before you get alarmed about this affecting your page speed, let me give you a few reasons to ease your mind:
- Our widget only loads where necessary. This should be a no-brainer, but you'd be surprised how often this is not the case. We sure were!
- Our widget only loads after the main page completes loading. That is, our widget is only mounted by the browser once the entire page has loaded as directed by its primary HTML document.
- Our widget is tiny: 1kB compressed. A larger script consumes more time and system resources to parse and execute. These are precious milliseconds that affect the experience of shoppers.
Once the widget has loaded, it attempts to mount an iframe on the page. An iframe is a way to embed a webpage inside another webpage. The embedded webpage gets its separate browsing context, the benefits of which are out of the scope of this article.
Upon mount, a request is sent to our servers to fetch the promotions. The server initially responds with a loader while our systems crunch data to find the best partners to show to the shopper. Post data crunching, the HTML document is populated with the promotions and loaded on the shopper's screen.
Here is an illustration of this entire process:
You can't fix till you measure
I'll begin this section by showing you an old clipping of our Thank You page experience on a test store:
We can surely do better. We will whip up Chrome's DevTools to help us dig further. The DevTools may look high-techy-techy at first glance, but I will keep it simple.
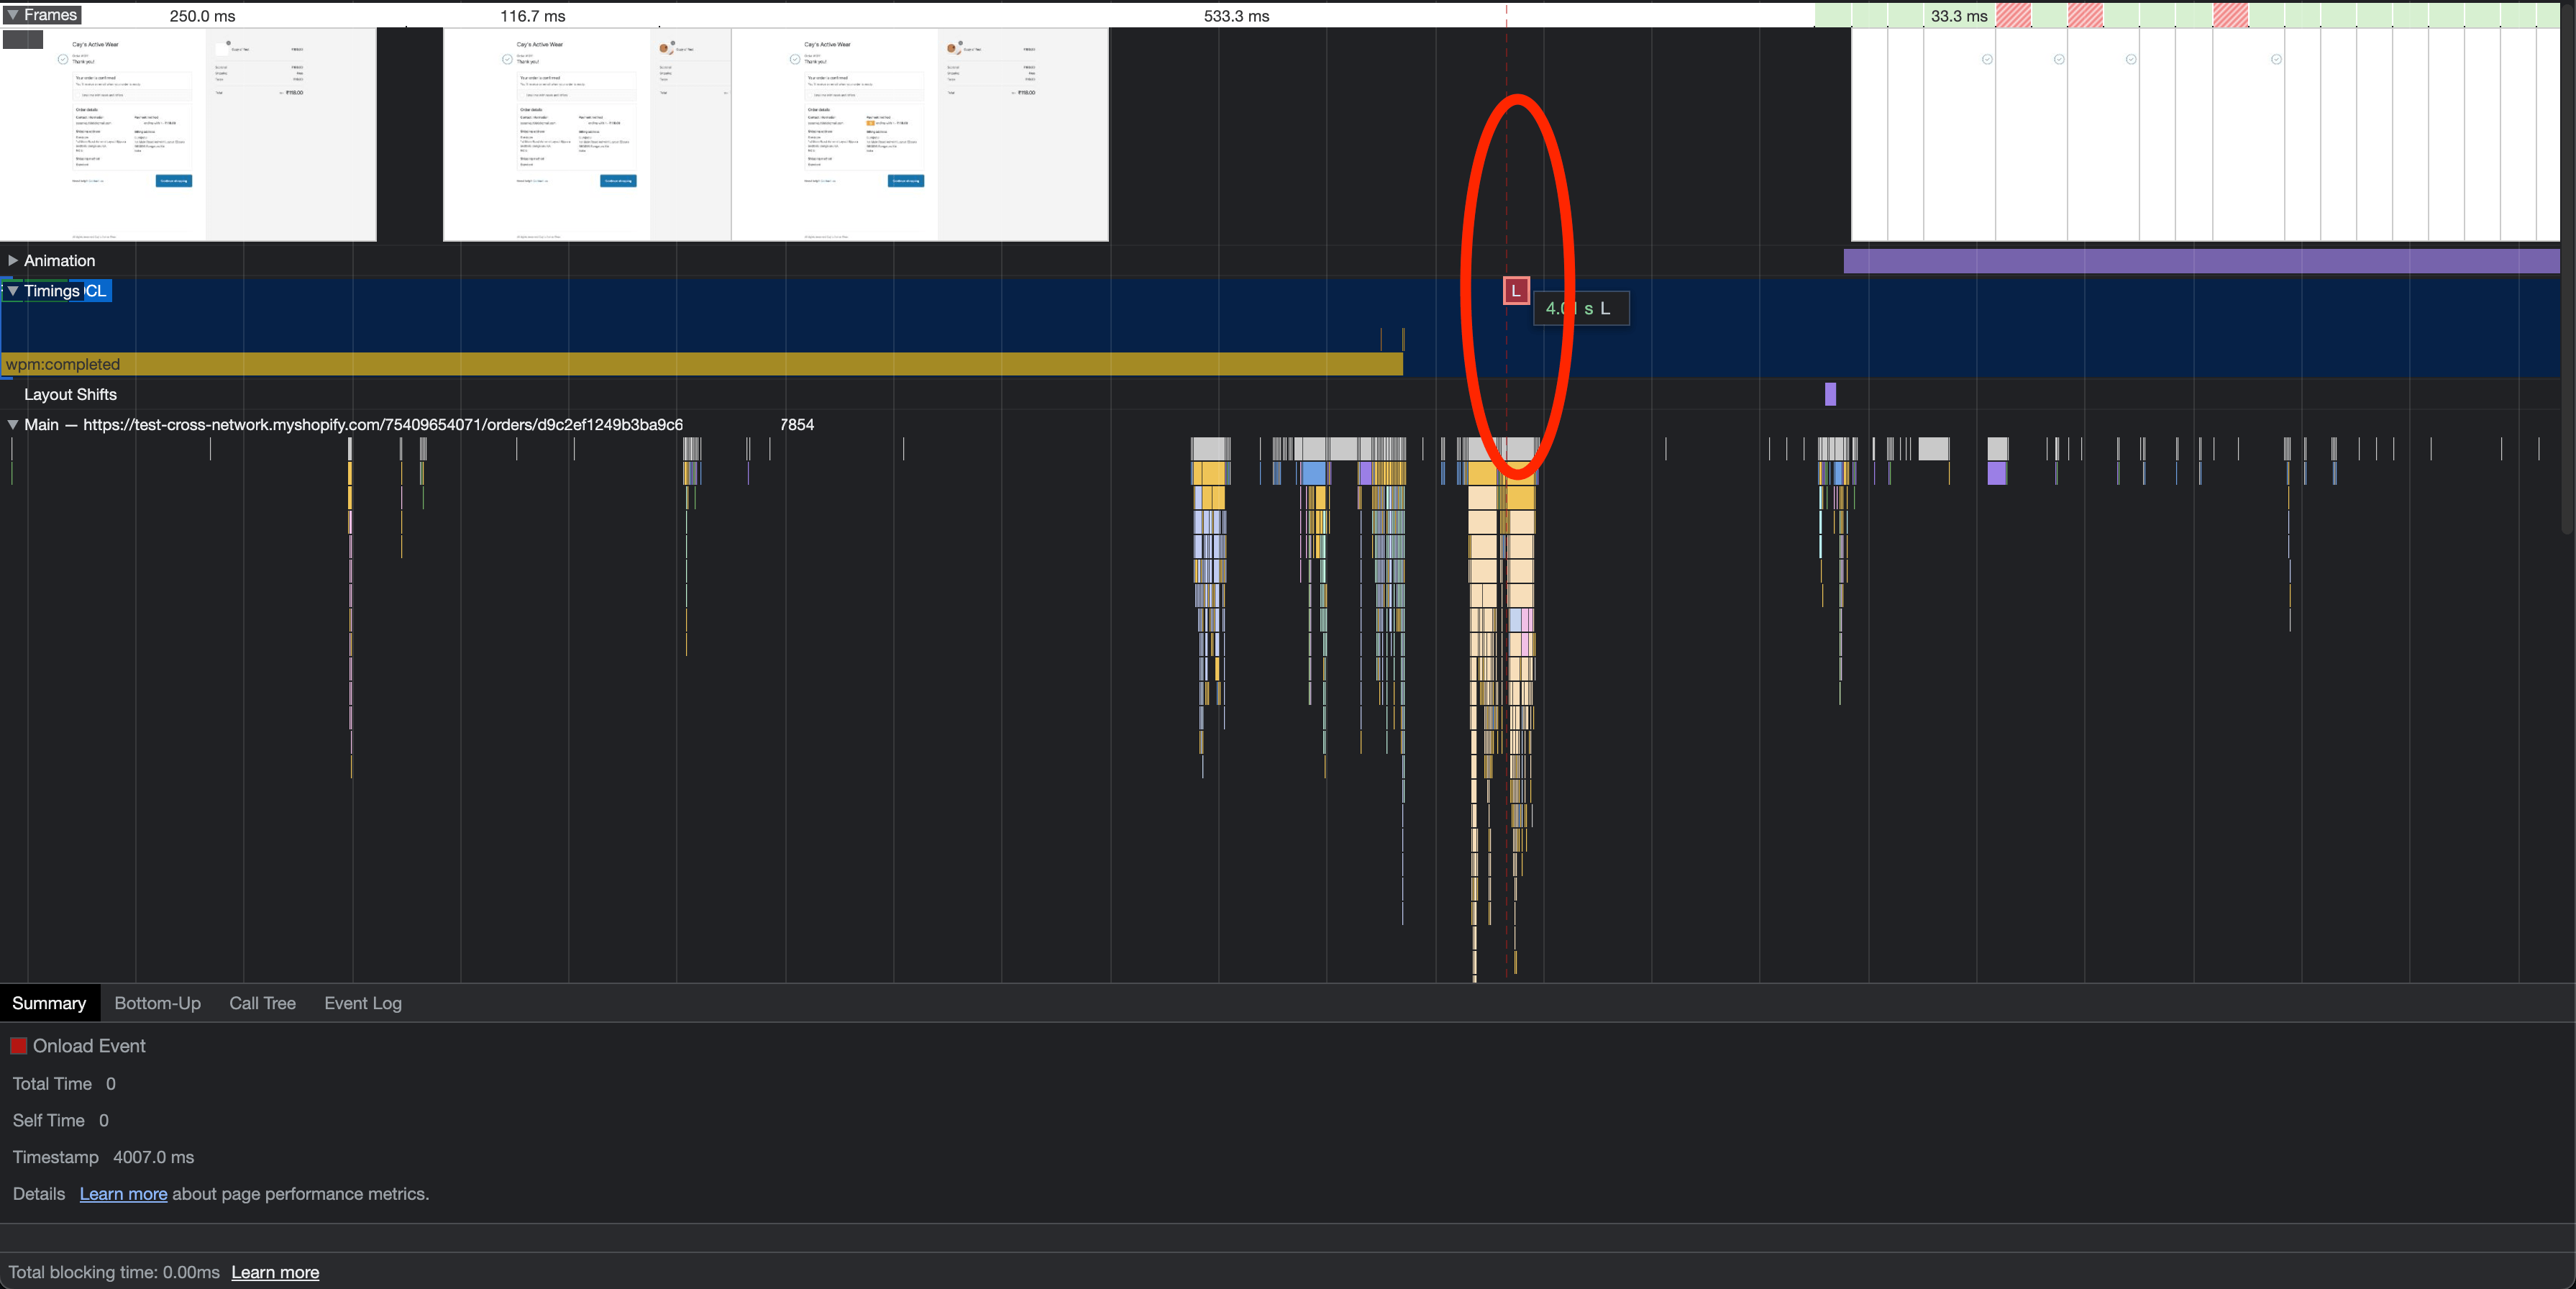
Notice the red L marker on the timeline. This marks the document load event. This is when the browser has completed rendering the HTML document as has been directed by Shopify's servers. Anything that runs after this will not affect core web vitals. Resources using the script tag API are also fetched after this event.
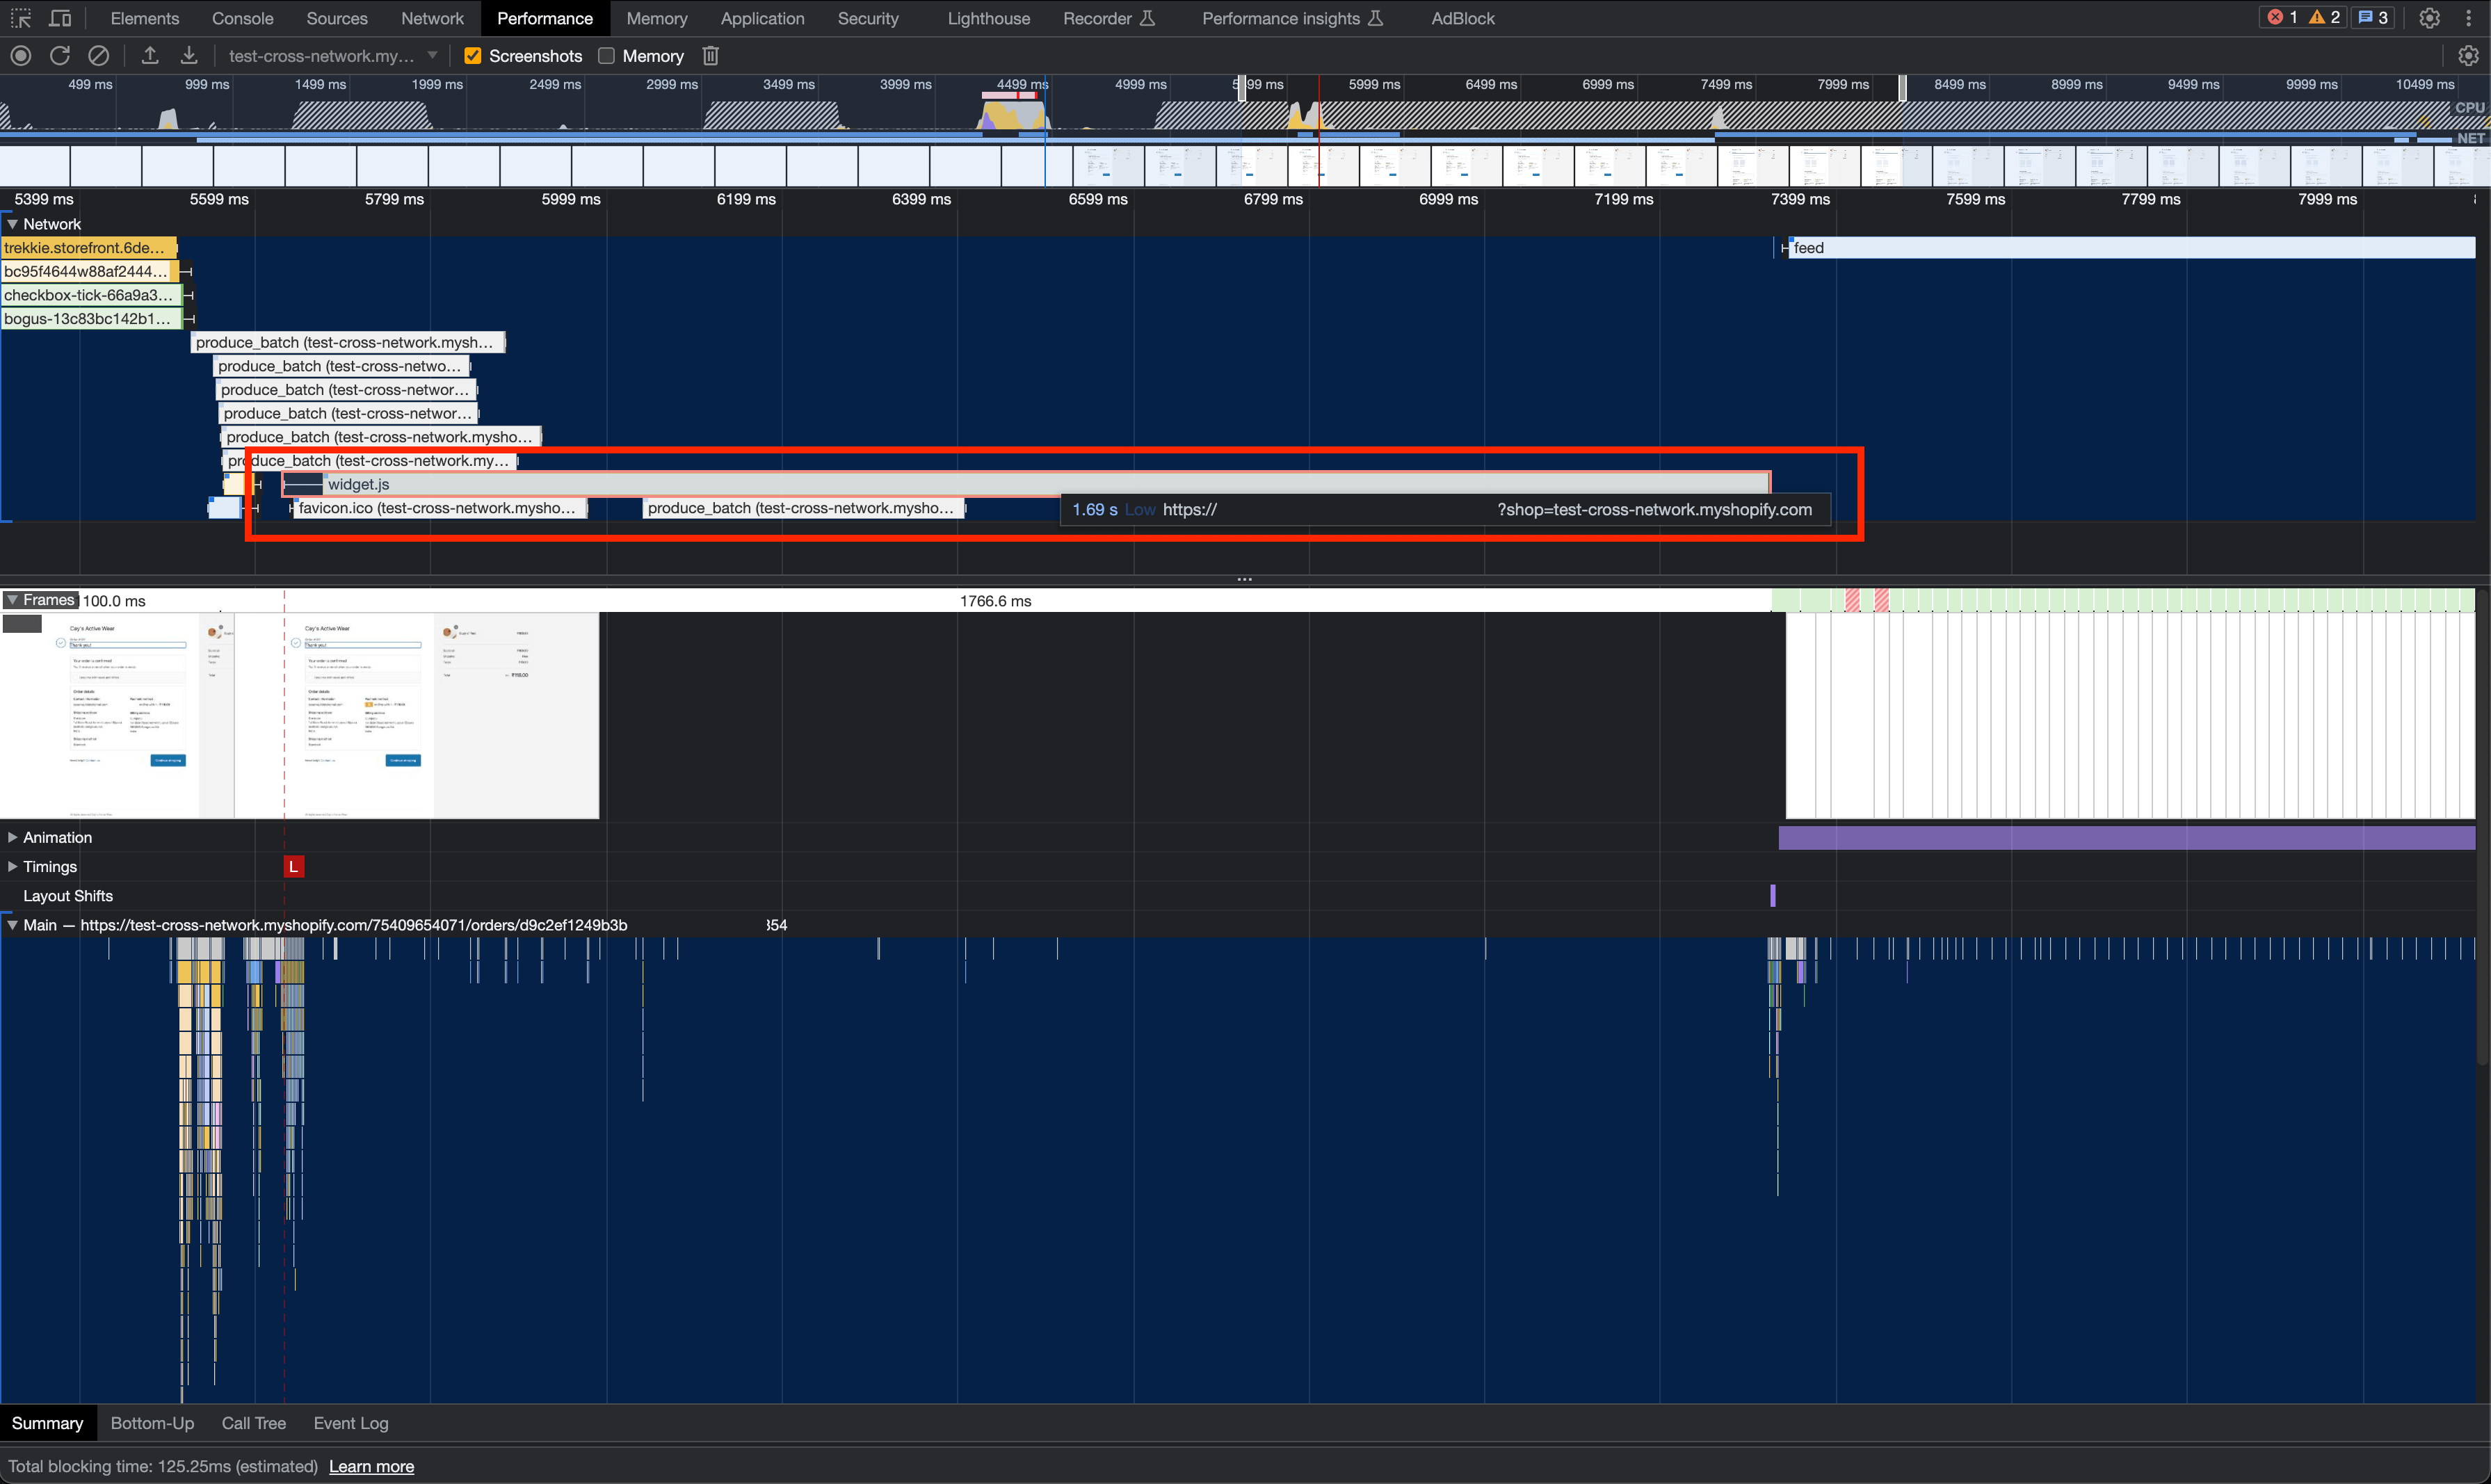
Zooming in, we can see that our widget script, the one named widget.js, is also fetched after the load event. Shopify also caches the script to reduce the response time. It takes more than 1.5 seconds to fetch the widget.
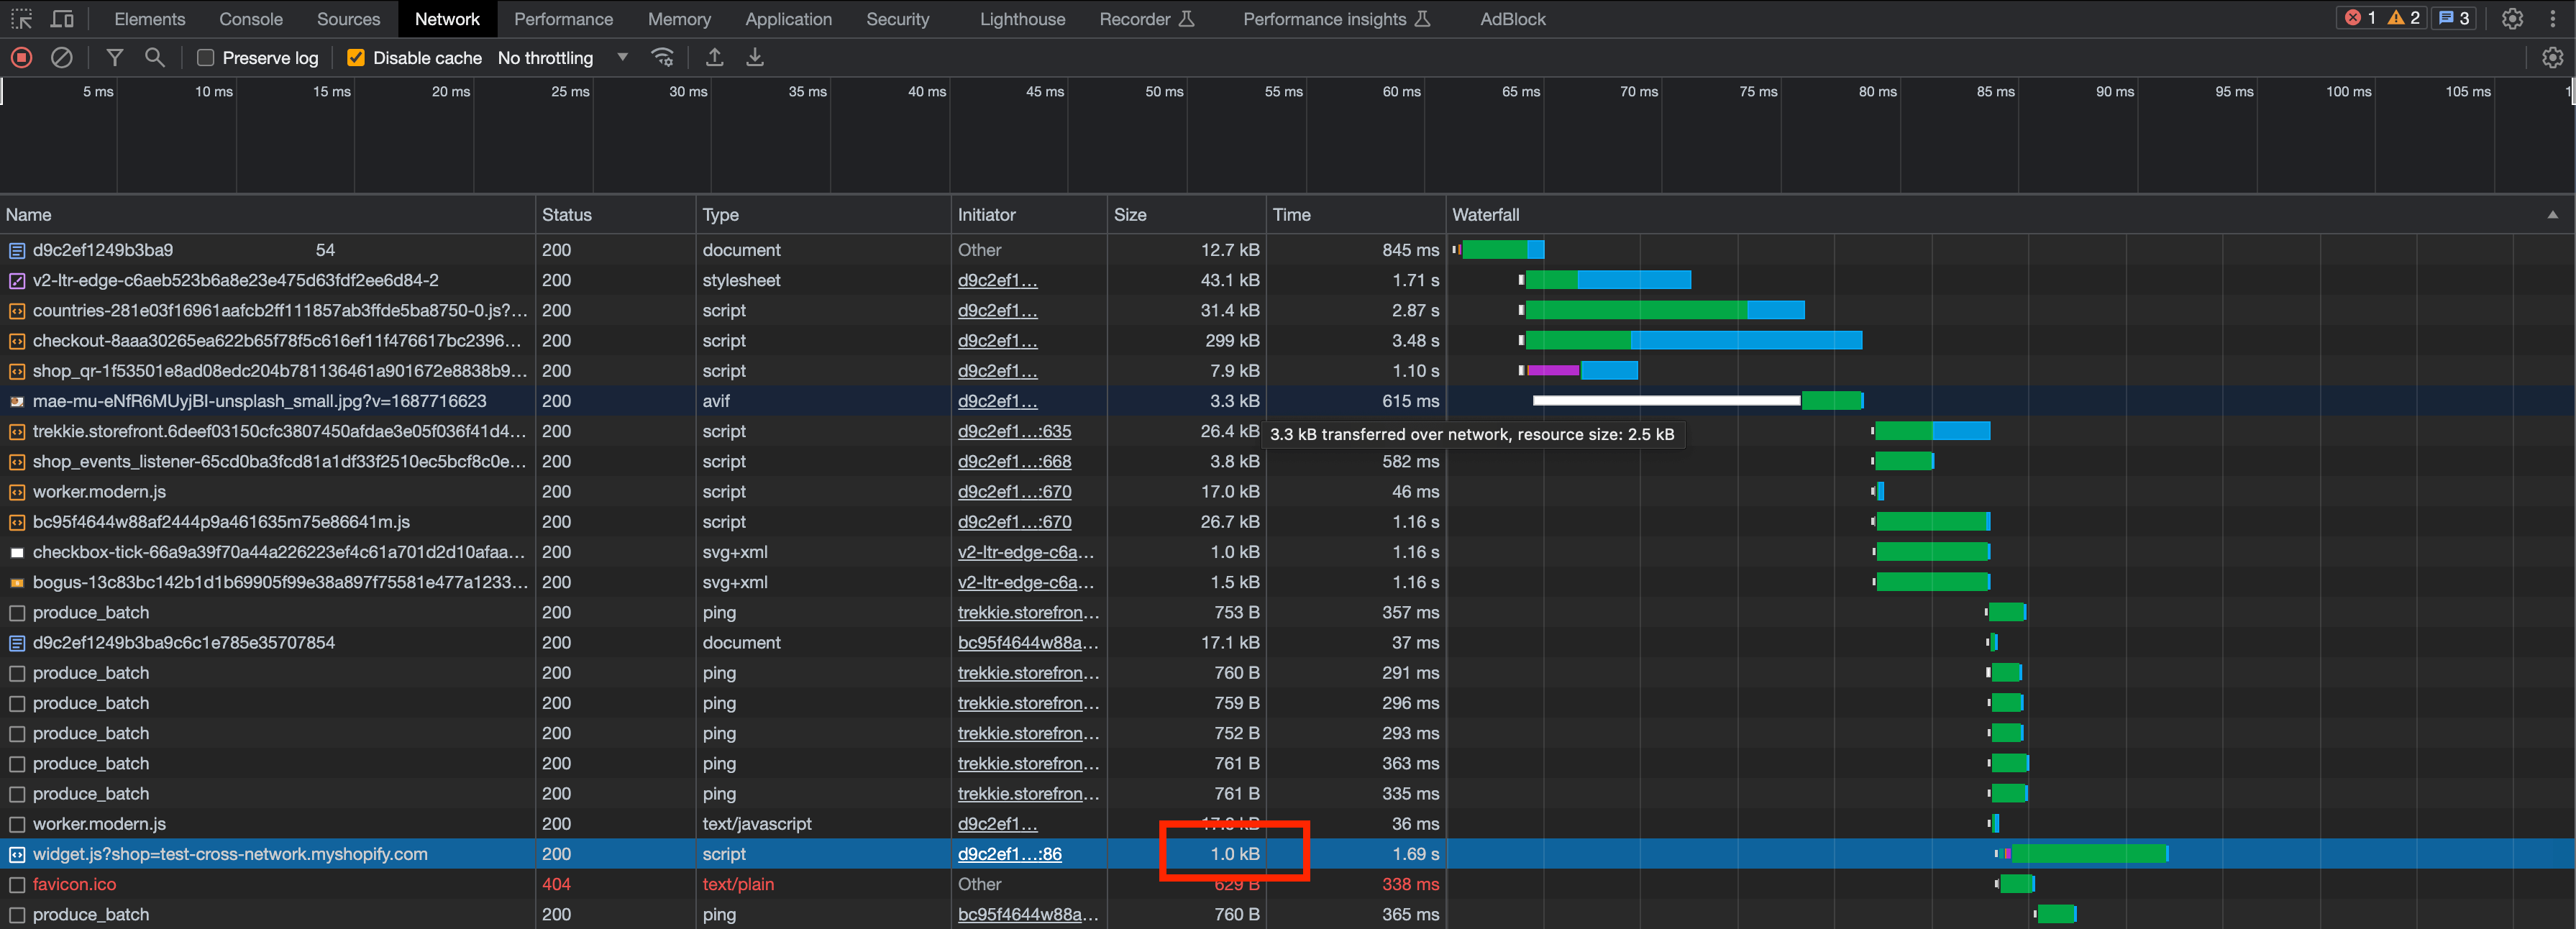
Notice the size of our script: 1kB compressed. In comparison, Google Analytics 4 is 134kB compressed. I told you it is tiny.
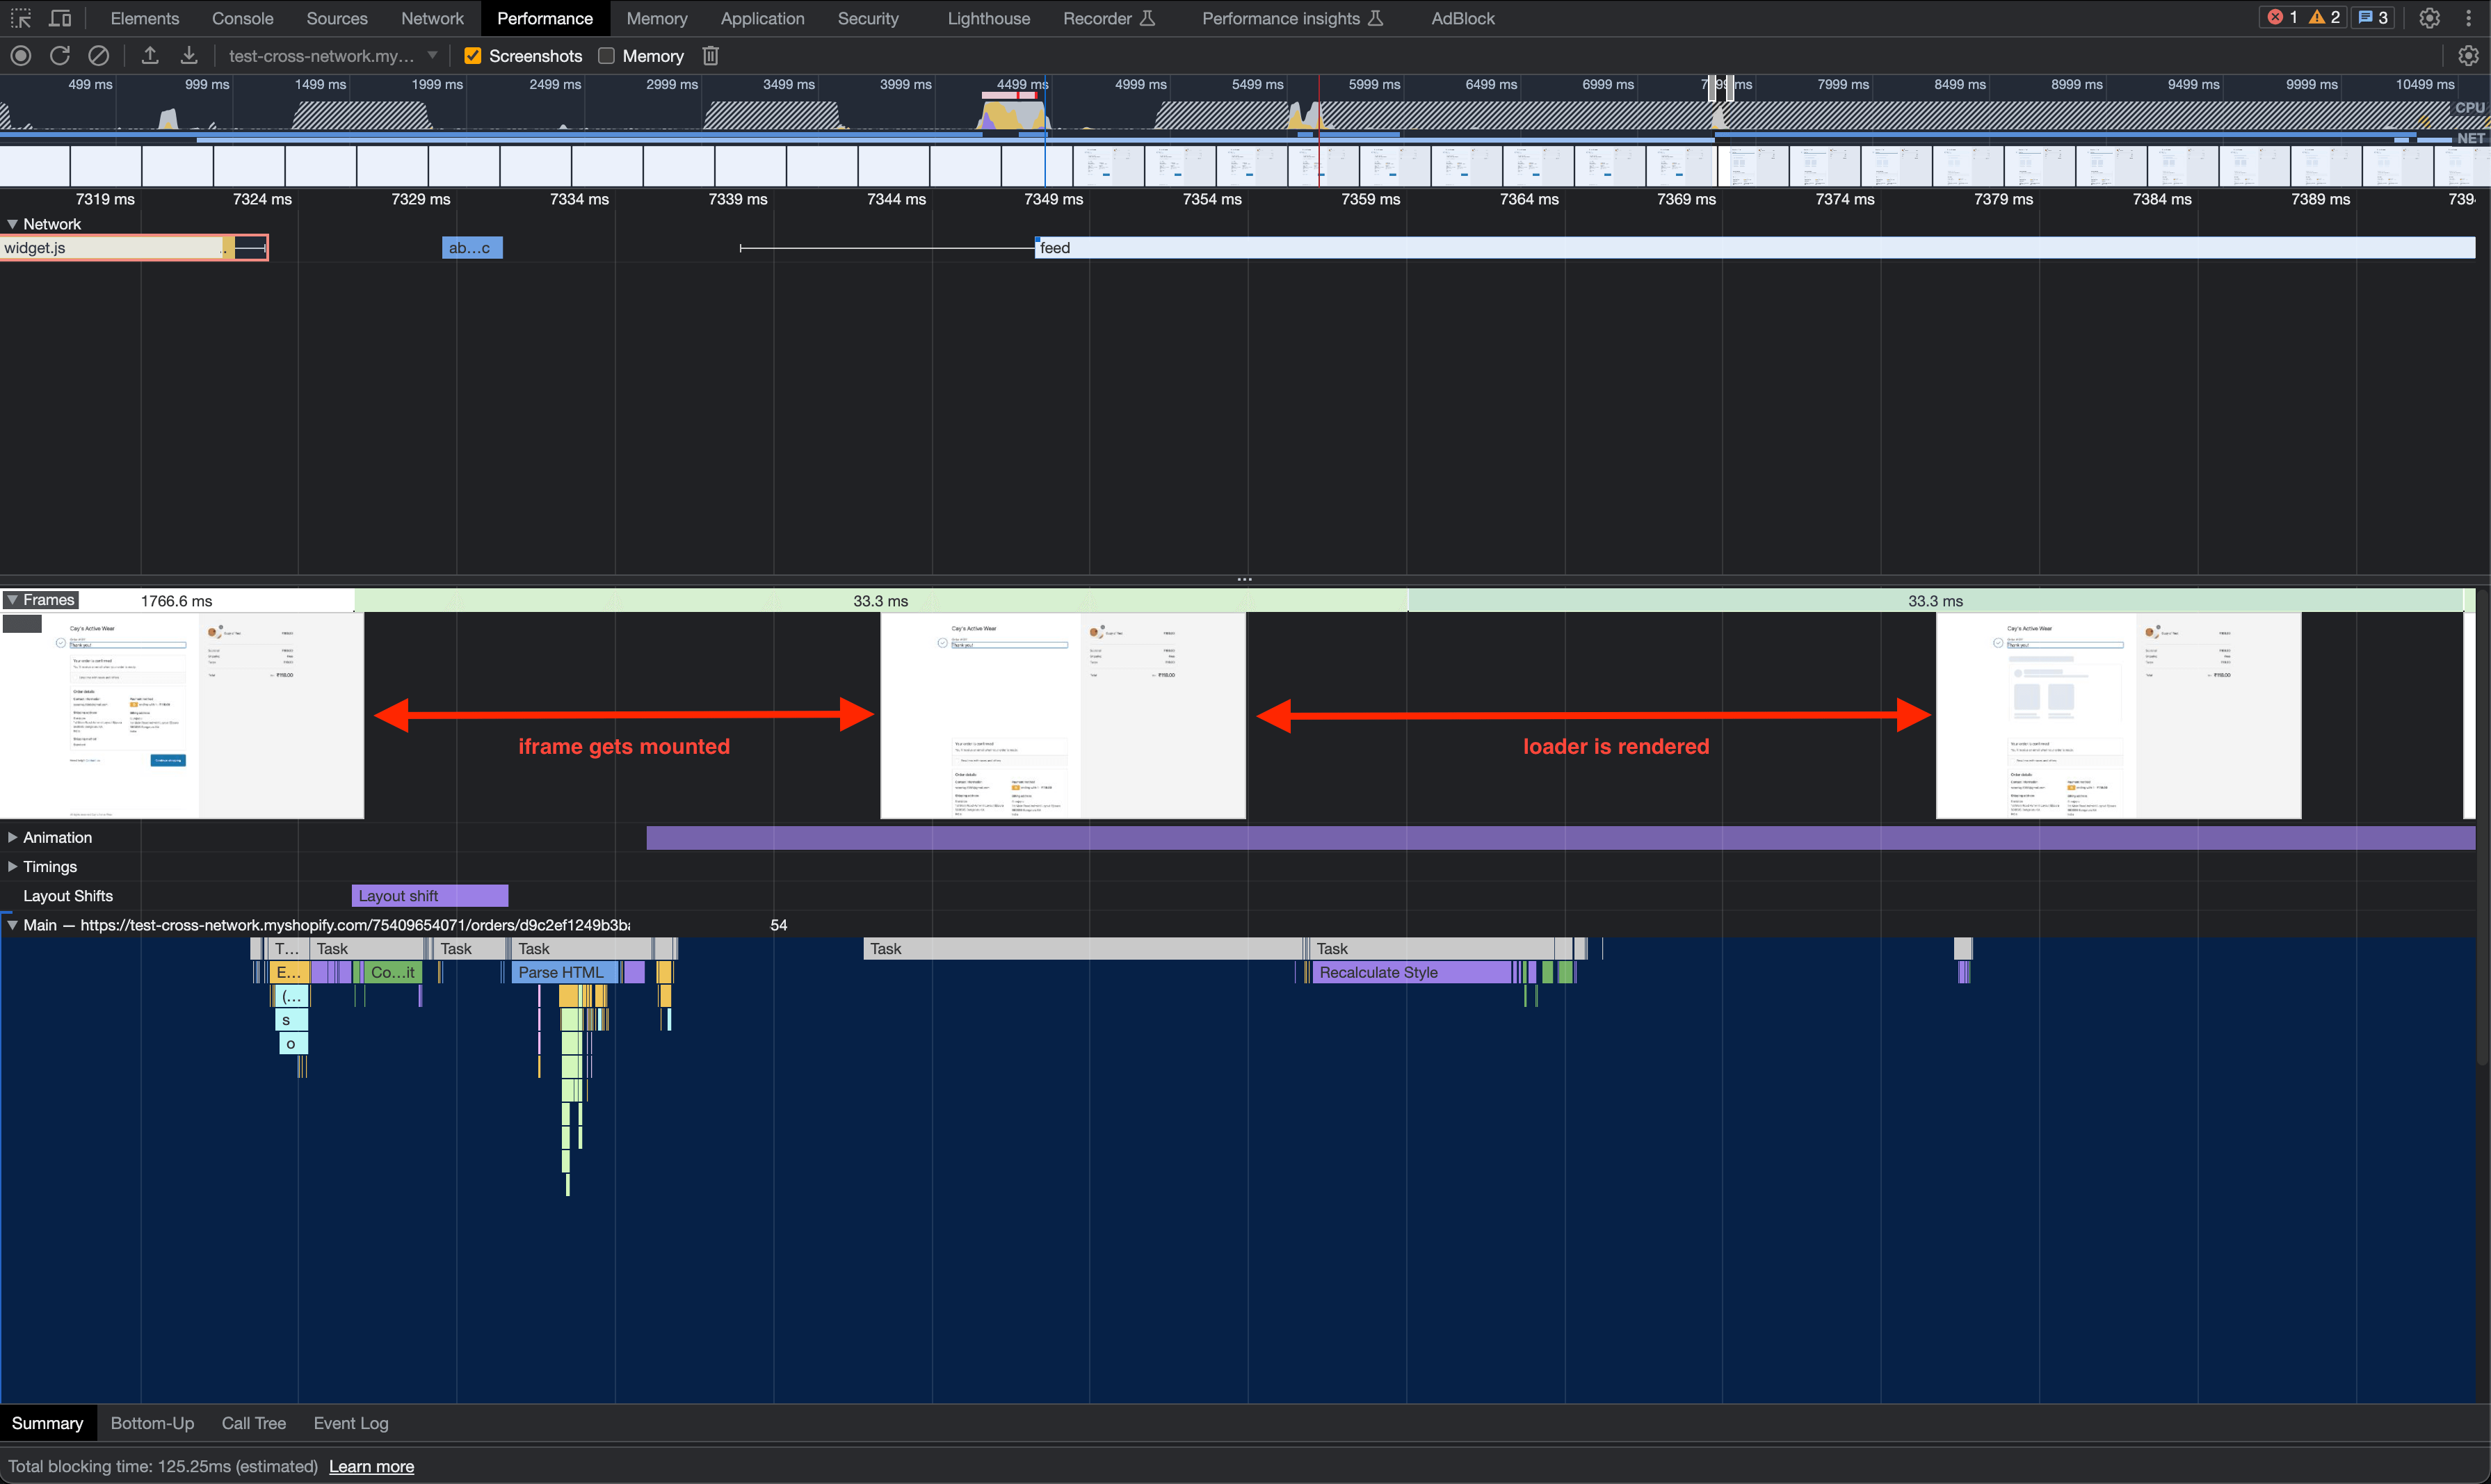
Zooming further, it takes another 15 milliseconds for the iframe to get mounted and another 35 milliseconds for the loader to show up. Our systems then take around one second to find the best promotions for this customer and render it on the screen.
In this release we decided to focus on two things:
- Reducing the time it takes to fetch the widget script from our server.
- Reducing the time for the loader to show up after the
iframeis mounted.
The case for page loaders
Loaders are ubiquitous on the internet nowadays. They spin, they bounce, they shimmer, and boy, do they crawl. But the thing they do best is buy some time. Showing a loader to a user is almost like an unspoken agreement. A user who would typically (and understandably) have a short attention span is now willing to stay just a while longer to see what comes after that shimmer. This time that is very important for our servers to do intensive operations like searching for partners, fetching their campaigns, calling the Shopify products API, and stitching the data into an HTML document.
Hence it became vital for us to measure the time it takes for the loader to show up from when the load event is fired. We internally track this metric as FSP or First Shimmer Paint. FSP is conceptually the same as First Contentful Paint, the main difference being the start time. For FCP, the start time is when the webpage URL is requested in the browser. In contrast, the start time for FSP is when the browser fires the load event.
An FCP of 1.8 seconds or lesser is considered a good user experience. We decided to set a target of 600 milliseconds for FSP.
Our deeds and their fruits
First, we parted ways with Shopify's script tag API cache and decided to use a different caching and content delivery system.
Next, we used the srcdoc attribute to package the loader with the widget script. This little known capability of iframe entirely cut out the need to go to our server just to fetch the loader content.
The results? We reduced the median widget download time to less than 120 milliseconds. We have also been seeing download times of just 20 milliseconds in some cases. Furthermore, it only takes an additional 20 milliseconds for the loader to show up due to our clever use of HTML features.
These improvements combined result in an FSP of 150 milliseconds, down from 1.7 seconds. Here is a clipping of the new Thank You page experience:

What next?
We are happy with the performance gains from this update. Future tasks entail making our recommender engine and HTML document generation framework faster. We will likely work on optimizing the HTML generation as it looks to be the lower-hanging fruit.